Historical Trend Periods Now Adjustable in the Grid

What’s New

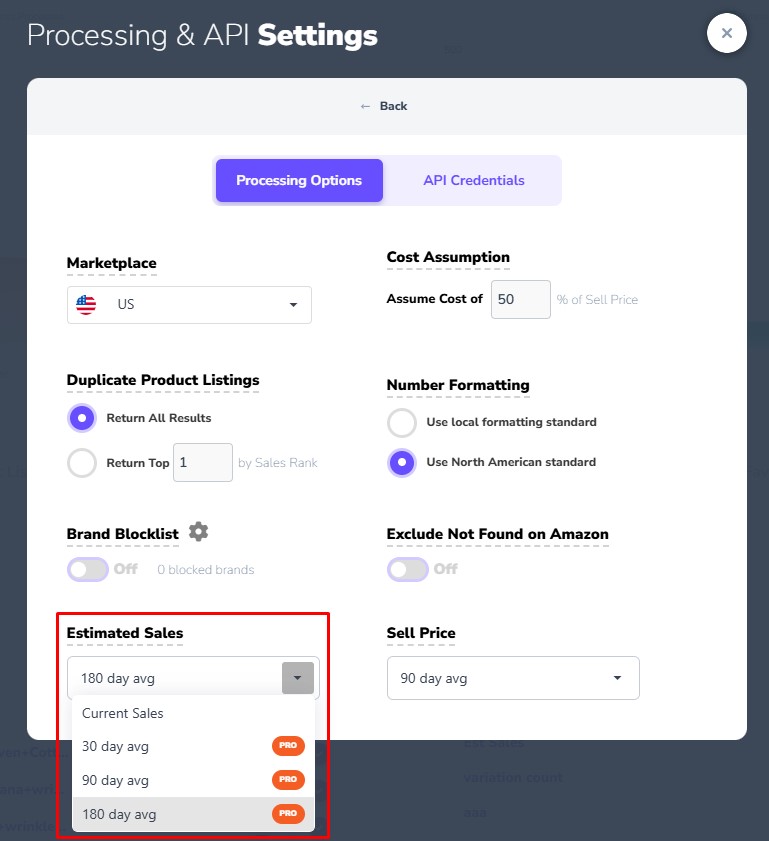
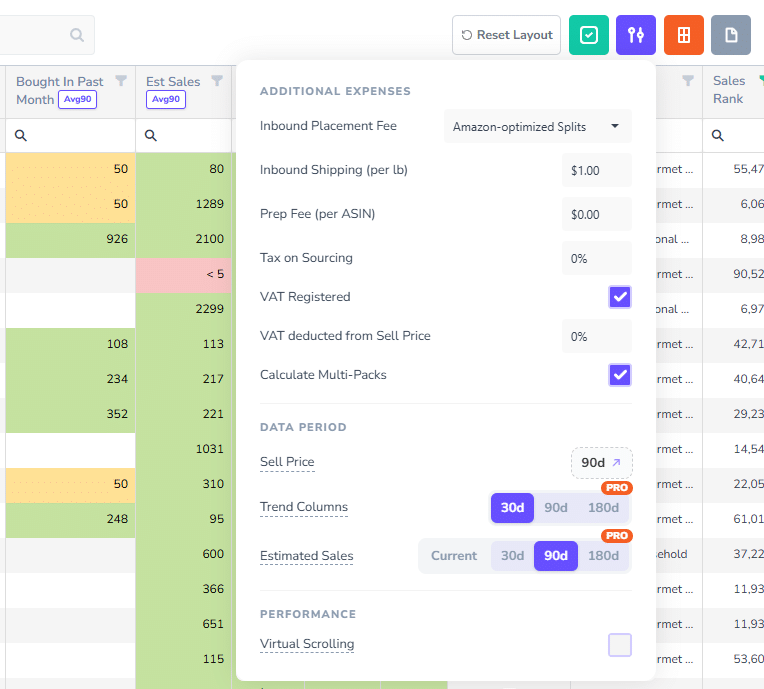
Historical Trend settings have been moved from Processing Options directly into the grid.

You can now switch between 30, 90, and 180-day historical periods instantly, without reprocessing your scan. We’ve also consolidated several historical trend columns, reducing grid clutter while making more historical data accessible on demand.

  • Introduction (00:00)
  • Example Using Est Sales Trends (00:20)
  • Example Using Trend Columns (01:42)
  • More Data, Less Clutter (02:35)
  • Conclusion (03:39)

Key Benefits

No reprocessing required
Switch between 30, 90, and 180-day historical periods instantly without running your scan again.

10 fewer columns
Historical trend data is now displayed more efficiently, creating a cleaner and easier-to-navigate grid.

Access more historical data
Previously, metrics such as Estimated Sales and Bought in Past Month could only display a single historical period selected during processing. To view a different period, you had to change your settings and reprocess the scan. You can now switch between historical periods instantly within the grid.

Faster analysis
Compare short-term and long-term trends without interrupting your workflow.

How It Works

  1. Run your scan as usual
  2. Toggle historical trend directly in the Grid Settings
  3. Choose Current, 30, 90, or 180-day historical averages
  4. The grid updates instantly with the selected timeframe
Image
Historical Trend Periods Now Adjustable In The Grid 2

Important Note

Sell Price historical periods remain managed through Processing Options and still require reprocessing.

This is intentional because Amazon fees, profit calculations, ROI, and related metrics are all derived from the selected Sell Price period. Reprocessing ensures these calculations remain accurate throughout the application.

This update gives you more historical insight, less grid clutter, and a faster workflow for analyzing product trends.

Override Incorrect Multi-Pack Quantities in Bulk

We’ve added a way to override incorrect Amazon package quantities for multi-pack products in stage.analyzer.tools.

What’s new

You can now upload ASIN package quantity corrections individually or in bulk. Package Quantity overrides will apply to all subsequent scans within the account.

  • Introduction (00:00)
  • Example 1: Negative Profit (00:31)
  • Example 2: Positive Profit (02:01)
  • Solution Demo (02:55)
  • Conclusion (04:23)

Key Benefits

  • Override incorrect multi-pack Package Quantities in bulk
  • Account-specific overrides apply to all scans
  • Improved profit calculation accuracy
  • Better large-scale wholesale analysis workflows

How it works

  • Either prepare a list of ASINs with corrected package quantities or add individual ASIN
  • Add the override(s) into stage.analyzer.tools in the Settings > Processing Options screen
  • Overrides are automatically applied to your account during all subsequent scans

That’s it. Better multi-pack accuracy with a scalable self-service workflow.

Show Premium Data Selectively For Faster Scans

We’ve added a faster, more flexible way to access Premium Data exactly when you need it.

What’s new
You can now process Premium Data on a selected subset of products, after filtering, just like “Show Reviews and Amazon Data” and “Check Selling Restrictions.”

Why it matters

  • Faster results – Premium Data can take time to process. Process only the products that matter instead of the entire dataset.
  • No more full reprocessing – Forgot to enable Premium Data on your initial scan? No problem. Just run it on your filtered shortlist.
  • Smarter usage – Ideal for high volume users when working within Premium Data limits.

How it works

  1. Filter your results down to a shortlist
  2. Select the products you want
  3. Click Show Premium Data

That’s it. Faster insights, less waste, more control.

Metric/Imperial Units, Digital Services Fee & Storage Fee Transparency

Overview

New update gives you more precise Amazon fee breakdowns and flexible measurement settings for better control of your Amazon data.

✅ Metric/Imperial Units
✅ Digital Services Fees
✅ More granular FBA/Storage Fees

📏 Measurement Units (Metric / Imperial)

By popular request, you can now control how product dimensions and weights are displayed in the app.

  • Imperial (lb, in)
  • Metric (kg, cm)

How it works:

  • Applies across the grid and exports to columns such as Package Weight and Package Dimensions.
  • Instantly standardizes all size and weight fields
  • Especially useful for international sellers and suppliers
Image 3
Metric/Imperial Units, Digital Services Fee &Amp; Storage Fee Transparency 5

🎯More Robust Amazon Fee Breakdown

We’ve added Digital Services Fee support and improved granularity for Fulfillment Fees.

Digital Services Fee:
Applied by Amazon to offset digital services taxes in certain regions. These fees typically impact Amazon sellers established in or selling into markets like the UK and parts of Europe.

Storage Fee & FBA Fee:
Previously combined under a single Fulfillment Subtotal column. These fees are now broken out into separate Storage Fee and FBA Fee columns for clearer visibility, while the original Fulfillment Subtotal is still retained.

🌍 Digital Services Fee (DSF) Settings

The Digital Services Fee is calculated based on logic defined in Amazon’s Seller Central documentation. The calculations depend on-

  • Your Amazon seller store Country of Establishment
  • The Amazon Marketplace you’re selling in

Action required:

We’ve added a new setting: Settings → Processing Options → Country of Establishment

  • Default is set to “Other country”
  • Update this to your actual country to ensure DSF is calculated correctly
Image 2
Metric/Imperial Units, Digital Services Fee &Amp; Storage Fee Transparency 6

✅ Summary

These updates are designed to:

  • Improve Amazon profit accuracy with clearer fee breakdowns
  • Ensure compliance with DSF calculations
  • Give you flexibility in how product data is displayed

If you have any questions or feedback, let us know!

Grid Autosave

Overview

stage.analyzer.tools now includes Grid Autosave, which automatically saves the state of your grid while you work. This means your filters, sorting, and grid setup are preserved even if you leave the page or refresh your browser. Check out the 1 minute demo video to see how it works!

How Grid Autosave Works

Grid Autosave automatically preserves:

  • Applied filters
  • Column sorting
  • Column visibility and layout
  • Other grid configuration changes

If you refresh the browser, navigate away from the page, or return later, your grid will be restored exactly the way you left it.

Resetting the Grid

If you want to start fresh, simply click the Reset button to return the grid to its default state.

Bulk Check Seller Restrictions (Amazon Ungating)

Manually checking Amazon ungating one product at a time in Seller Central is slow and painful, especially when you’re working with large wholesale or arbitrage lists.

stage.analyzer.tools solves this by letting you bulk check seller restrictions for thousands of products at once, so you can instantly see what you’re actually allowed to sell.

🎥 Watch: Bulk Amazon Ungating in Action

Bulk Check Seller Restrictions (Amazon Ungating)

This video walks through the full workflow:

  • Starting with a large supplier list (~26,000 products)
  • Filtering down to potential winners
  • Running Check Seller Restrictions
  • Interpreting results: Selling Allowed, Approval Required, Not Eligible
  • Requesting approval directly when needed

If you’re short on time, the video is the fastest way to understand and use this feature.

What the Feature Does

The Check Seller Restrictions feature allows you to bulk-check Amazon eligibility and ungating status for up to 20,000 ASINs at once.

For each product, stage.analyzer.tools returns one of three clear statuses:

  • Selling Allowed – You can sell immediately
  • Approval Required – Approval is needed (includes a direct request link)
  • Not Eligible – You cannot sell this product

Recommended Workflow

  1. Upload or analyze your product list
  2. Apply filters (e.g. Potential Winners) to reduce the list
  3. Select the remaining products
  4. Click Check Seller Restrictions
  5. Filter results to Selling Allowed to focus on products you can sell now

💡 Processing Speed Note:
Amazon limits seller restriction checks to approximately 5 products per second. Because of this, very large batches (up to 20,000 ASINs) can take a significant amount of time to complete. For best results, we strongly recommend filtering your list to a smaller set of potential winners before running this check.


Why This Matters

This feature can save dozens of hours by eliminating manual Seller Central checks and helping you focus only on products that:

  • Are profitable and
  • You’re actually eligible to sell

It’s especially useful for:

  • Wholesale sellers
  • Online arbitrage (OA)
  • Retail arbitrage (RA)
  • Large supplier price lists

Need Help?

If you have questions about seller restrictions, ungating, or your results, contact support or watch the video above for a complete walkthrough.

Update to Premium Data Usage

To ensure fast, reliable performance for Premium Data users, we’re implementing a usage cap of 1MM products/month for Premium Data offered in the Web App Pro plan.

➡️ This does not apply to standard data processing.

💡 Higher Premium Data limits are available with enterprise plans, contact support.

Why This Helps

  • Better experience for 99% of users: Only <1% of users exceed this threshold, but their usage can impact Premium Data queue times for everyone else.
  • Faster, more consistent performance: Premium Data bandwidth is limited, and heavy use by a small number of users can slow things down for the vast majority.
  • Enterprise options available: Users who need higher limits can reach out to explore custom solutions.

What’s Actually Changing

  • Premium Data scans will be limited to 1MM Premium products. This does not affect 99% of users.
  • Premium Data remains optional and can be toggled per scan.
  • Standard Data is unaffected and plans without Premium Data remain unchanged.

Who’s Impacted

Only Web App Pro users who enable Premium Data. Most users will see no change to their workflow.

Need More Capacity?

Contact us anytime, we’re happy to discuss higher-limit enterprise plans.

Break Even Amazon Sell Price, Thumbnails and Image Gallery

stage.analyzer.tools update introduces customer requested updates which greatly enhance the efficiency of analyzing Amazon wholesale products for profit and sales history.

? Break-Even Sell Price added to historical charts and dedicated grid column

? Product thumbnail image is now always visible with added enhancements such as image gallery view to see all Amazon images.

  • Quick demo (00:00)
  • Break Even Sell Price Explanation and Demo (0:36)
  • Thumbnails and Image Gallery Demo (3:12)
  • Conclusion (04:10)

Break-Even Sell Price

Understanding the break even selling price on Amazon helps you determine the minimum price a product needs to sell for to cover its costs. This is important to ensure you don’t lose money on each sale. Using stage.analyzer.tools, you can easily determine how long the product has been selling above the break even point in the the last 30, 90 or 180 days. This can dramatically reduce your risk when deciding which products to sell on Amazon.

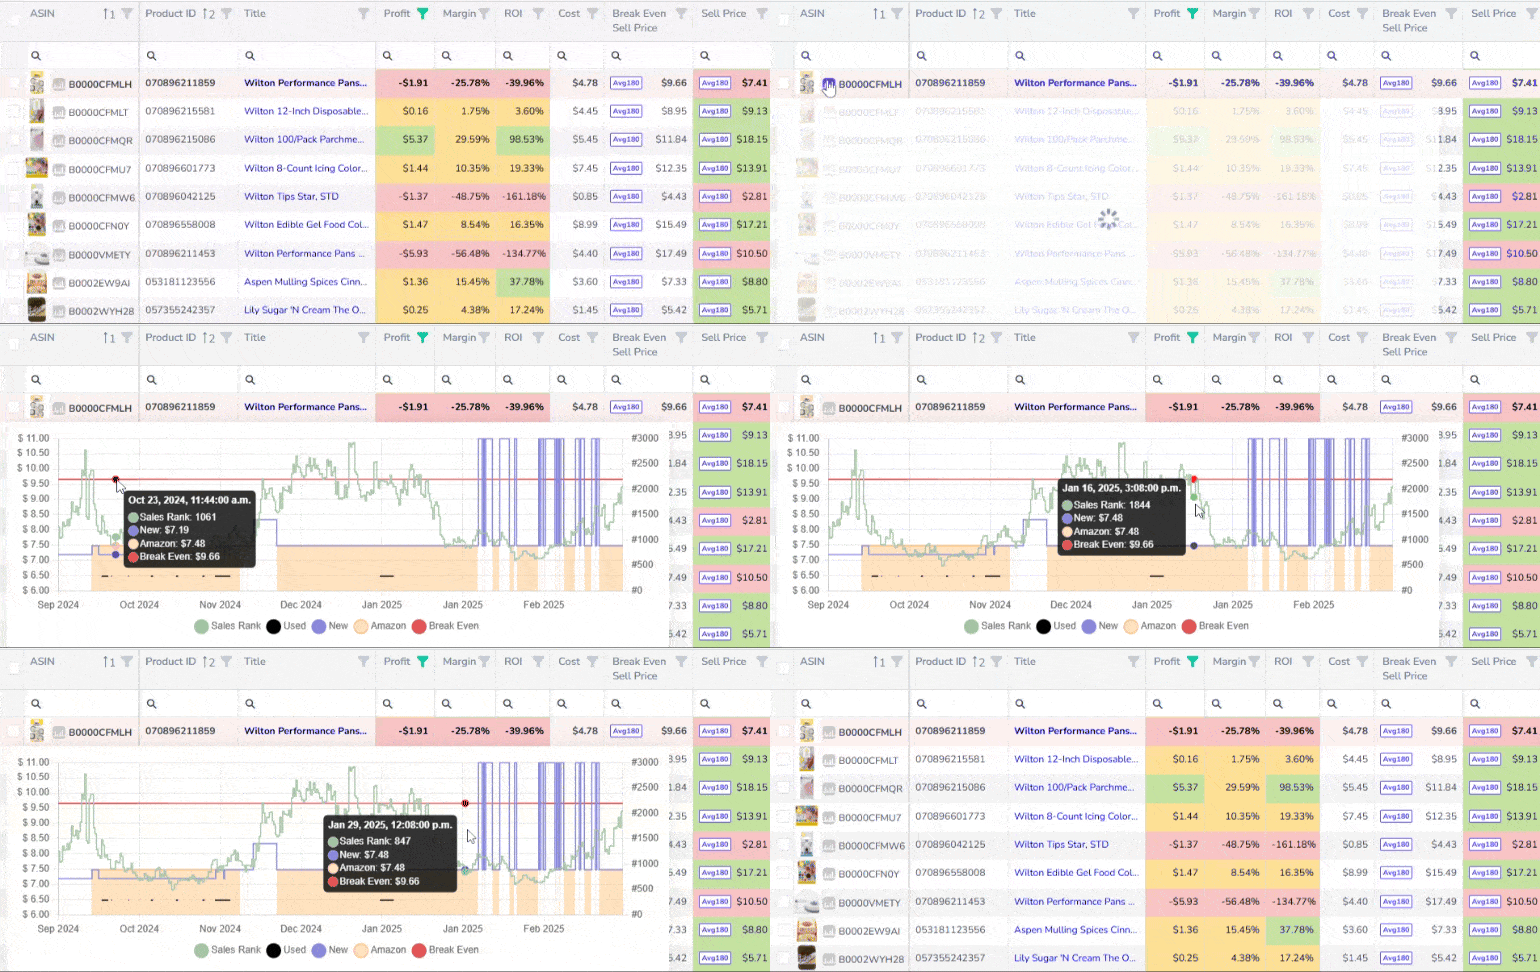
? Historical hover chart now contains break even $. You can clearly see the “New” selling price (blue line) is historically higher than the red “Break Even” cost which indicates steady profit potential!

Break even is added to the charts in the main grid as well as Product Detail pages. When in the grid, click on the hover chart icon to lock it in place, allowing your mouse cursor to interact with the chart.

Amazon Break Even Historical Chart
Break Even Amazon Sell Price, Thumbnails And Image Gallery 11

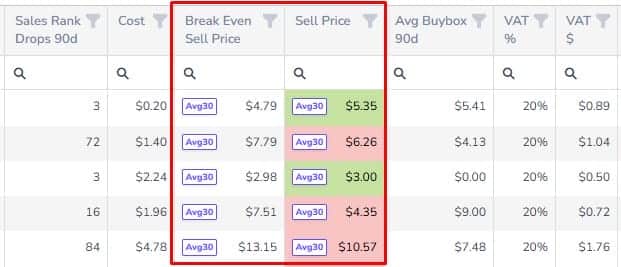
? Break Even Sell Price is also included as a dedicated grid column. For convenience, the Sell Price column is highlighted green/red to indicate whether Sell Price is higher (green) or lower (red) than Break Even.

Breakeven Grid
Break Even Amazon Sell Price, Thumbnails And Image Gallery 12

? All of this data is dynamic which changes as other variables may change. For example, adjusting your Cost (COGS), Sell Price, Inbound Shipping, VAT, etc., will impact your Break Even Sell Price and Profit in the chart and grid instantly!

? This enhancement builds on Interactive Historical Charts which was previously released.

Product Thumbnails and Image Gallery

Product Thumbnails have been enhanced to improve the way you source wholesale products to sell on Amazon. Viewing an image of the product is pivotal for ensuring the product you’re viewing matches your supplier’s product as well as reviewing the quality (and value-add potential) of product listings on Amazon in general.

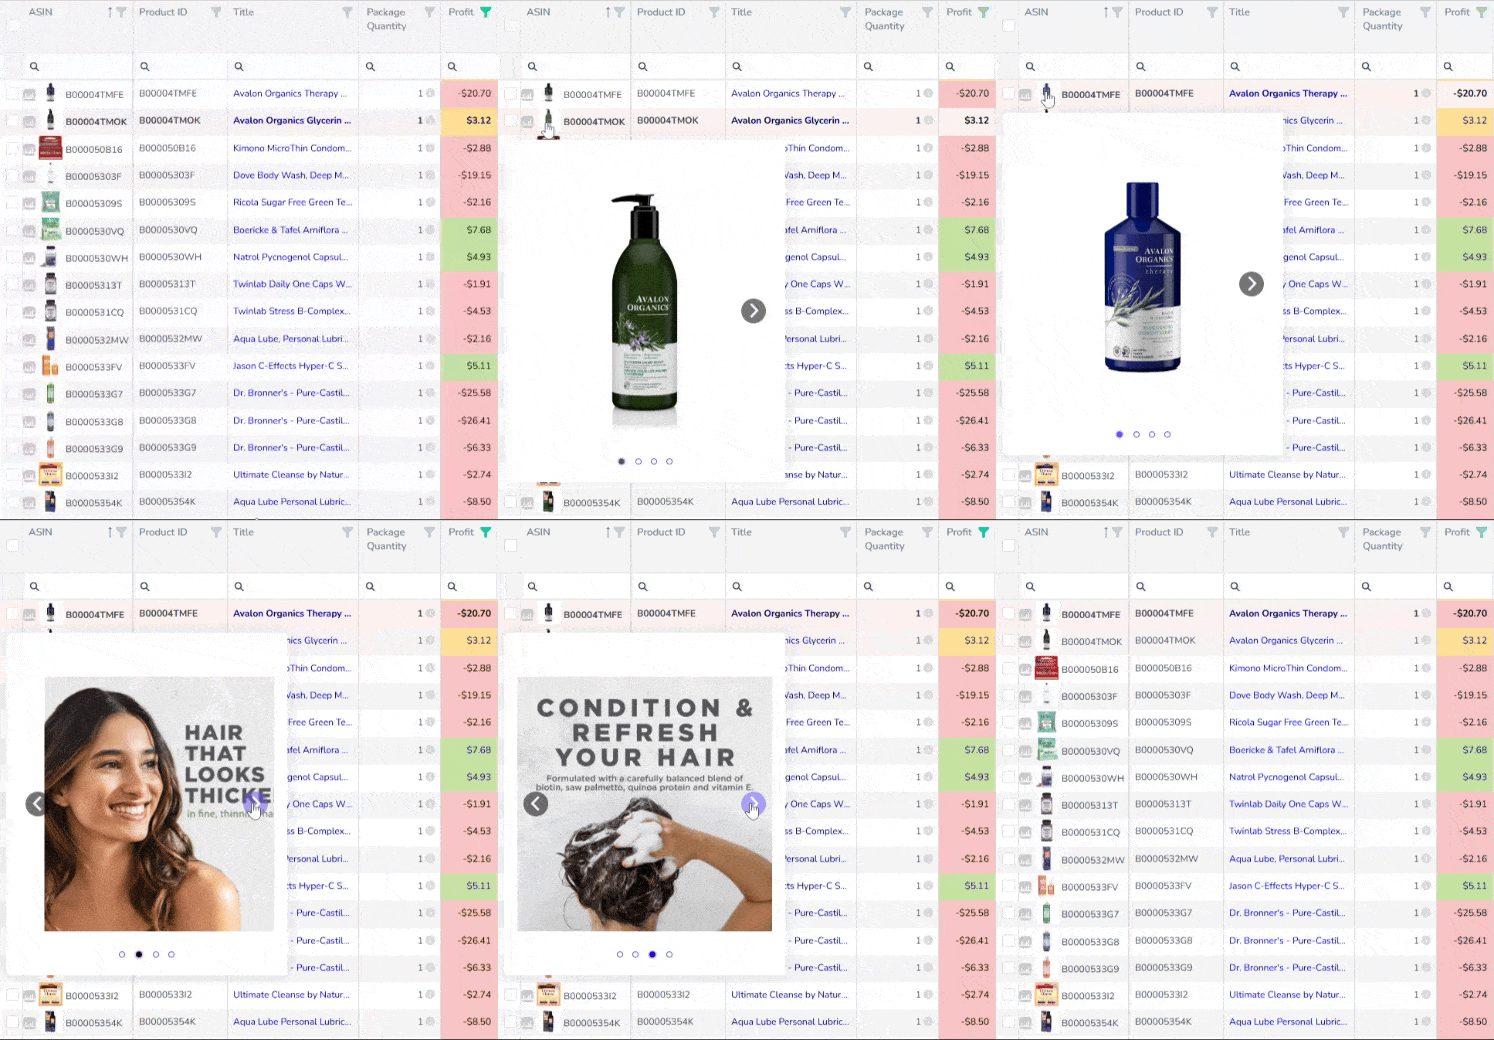
? Thumbnails are now always visible in the grid without hovering

? Hovering on thumbnails expands to a larger view of the product image

? Clicking on the thumbnail locks it in place, allowing access to product image gallery!

Thumbnail Demo Showing New Image Gallery
Break Even Amazon Sell Price, Thumbnails And Image Gallery 13

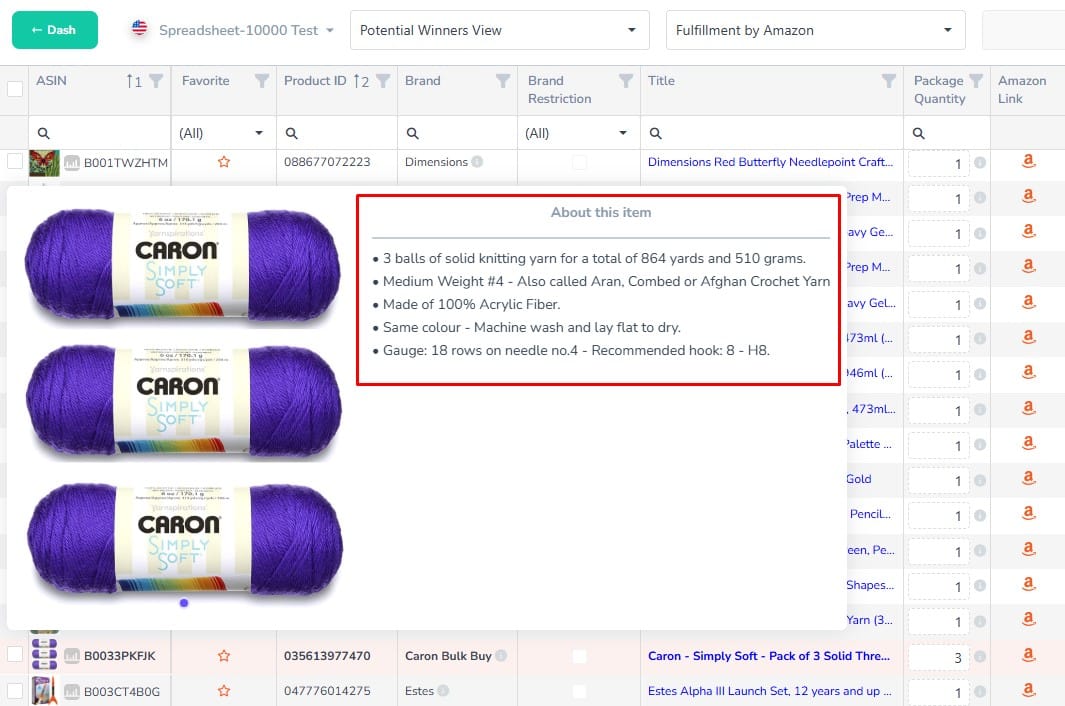
? On 5/25/2025 the “About this product” information was added to the thumbnail hover image! This is the same product information that’s displayed on the Amazon product page. This feature applies to scans processed on or after the update release date.

Stage.analyzer.tools Product Thumbnail Hover Showing Product Information
Break Even Amazon Sell Price, Thumbnails And Image Gallery 14

How to get Break Even Sell Price and Thumbnail Gallery for Amazon Wholesale Analysis

Break Even Sell Price is available with no additional charge on all stage.analyzer.tools Web app plans. You can view our plans and sign up in the Pricing Table of the stage.analyzer.tools website.


Please be sure to visit, subscribe and share our Facebook, YouTube & X page to be the first to get the latest updates on program developments and new features!

“Bought in Past Month” for Bulk Spreadsheet Search

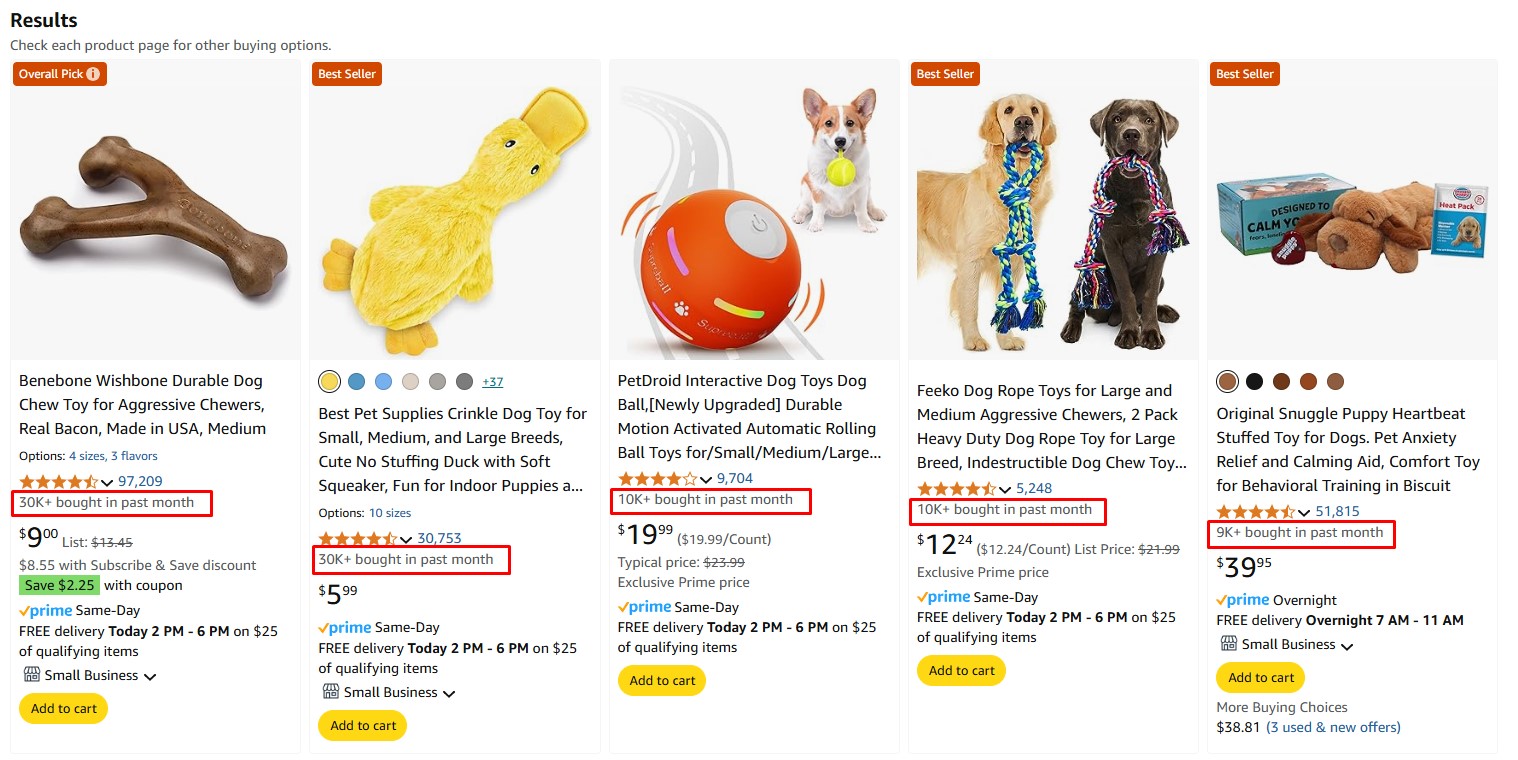
Amazon’s new “Bought in Past Month” data showing real sales performance has been added to stage.analyzer.tools wholesale Spreadsheet Search.

?This is not an estimate, its the only real sales data available directly from Amazon.

?No other app has this data available in bulk to scan your wholesale supplier catalogues, so get ahead of the game!

  • Introduction (00:09)
  • Bought in Past Month data (0:42)
  • Variations with Bought in Past Month vs Est Sales (0:58)
  • Historical Bought in Past Month data (1:50)
  • How to configure Historical Bought in Past Month settings (2:42)
  • Comparing Bought in Past Month vs Est Sales (3:05)
  • Conclusion (04:24)

We previously added Amazon’s “Bought in Last Month” for Variations which was only available in the Product Detail page. Now this data is available in bulk inside of the main grid. This enables you to filter thousands of products using “Bought in Last Month” for real Amazon sales.

Amazon Sales Estimates vs “Bought in Past Month”

Many 3rd party Amazon services offer estimated sales but the truth is these estimates are educated guesses since Amazon hasn’t revealed real sales data, until now!

Estimated Sales

  • Algorithmic guestimates based on Sales Rank and Product Category
  • Estimates may vary wildly for the same ASIN between multiple platforms
  • Sales Estimates can’t accurately estimate variation product sales so the entire batch of variants are estimated at the same value. This can be very misleading as some variants may sell well and others may not.

“Bought in Past Month”

  • Real sales data published directly by Amazon
  • Shows sales on the variation level! No more guesswork to determine which variant on a variation listing is getting the bulk of the sales. No more risky purchases to determine you’re selling the wrong variant.
Bought In Past Month
"Bought In Past Month" For Bulk Spreadsheet Search 17

Historical Amazon Sales Using “Bought in Past Month”

Not only does stage.analyzer.tools provide the current snapshot of an ASINs sales performance using “Bought in Past Month”, it also provides the option to see sales from a 30, 90 or 180 day historical perspective as well. This is extremely useful to account for sales spikes and seasonality which may skew sales estimates. For simplicity, this feature is configured in the Settings screen in the same way as Averages for Est Sales and Sell Price.

Estimated Sales And Bought In Past Month
"Bought In Past Month" For Bulk Spreadsheet Search 18

Some things to keep in mind..

? “Bought in last month” is real sales data and it may vary from “Est Sales” which is an algorithmic estimate of sales. Do not be surprised to see this!

? Not all products have enough sales volume to generate a “Bought in last month” value. If you see a blank, that’s likely the case.

? We’re still showing the Est Sales data in addition to the new “Bought in last month”. You may notice the values between the two can vary and when in doubt, the “Bought in last month” is always the most accurate.

? Est Sales doesn’t differentiate between variants in a variation listing while “Bought in last month” does. Therefore, you may notice huge differences in values when looking at a variation listings. The “Bought in last month” will show the variant level sales while Est Sales shows the estimated total sales for all variants combined.

Related: Amazon’s “Bought in Last Month” for Variations

How to get “Bought in Past Month” for your Wholesale Spreadsheet Search

“Bought in Past Month” Sales data is only available with the stage.analyzer.tools Web app Pro. You can compare our plans and sign up for a Pro account in the Pricing Table of the stage.analyzer.tools website. If you’re a current customer, you can upgrade your account to Pro, simply reach out to us and request an upgrade!


Please be sure to visit, subscribe and share our Facebook, YouTube & Twitter page to be the first to get the latest updates on program developments and new features!

Interactive Sales History Charts

Interactive sales history charts allow you to analyze historical sales rank and product selling price over 30, 90 or 180 days in a convenient chart. Watch this short video demo to see how the feature works!

Hope you enjoy the update!  Please be sure to visit, subscribe and share our Facebook, YouTube & Twitter page to be the first to get the latest updates on program developments and new features!