“Bought in Last Month” for Variations

? Amazon’s newest “Bought in Last Month” data has been added for variations. This data is not another sales estimate, it’s real Amazon sales data for variations!

Some background..

Understanding what variations are selling has long been a game of educated guessing. This is because Amazon assigns one sales rank to all variants and all “Estimated Sales” tools use the Sales Rank to estimate their sales. So how do sellers know which variant to sell if there was no reliable sales data? We used to estimate using variant level # of reviews but that approach has many limitations. For example, what if it’s a new variant that’s selling like a banshee? You would never know.

Related: Harnessing Data: Metrics That Predict Amazon Product Success

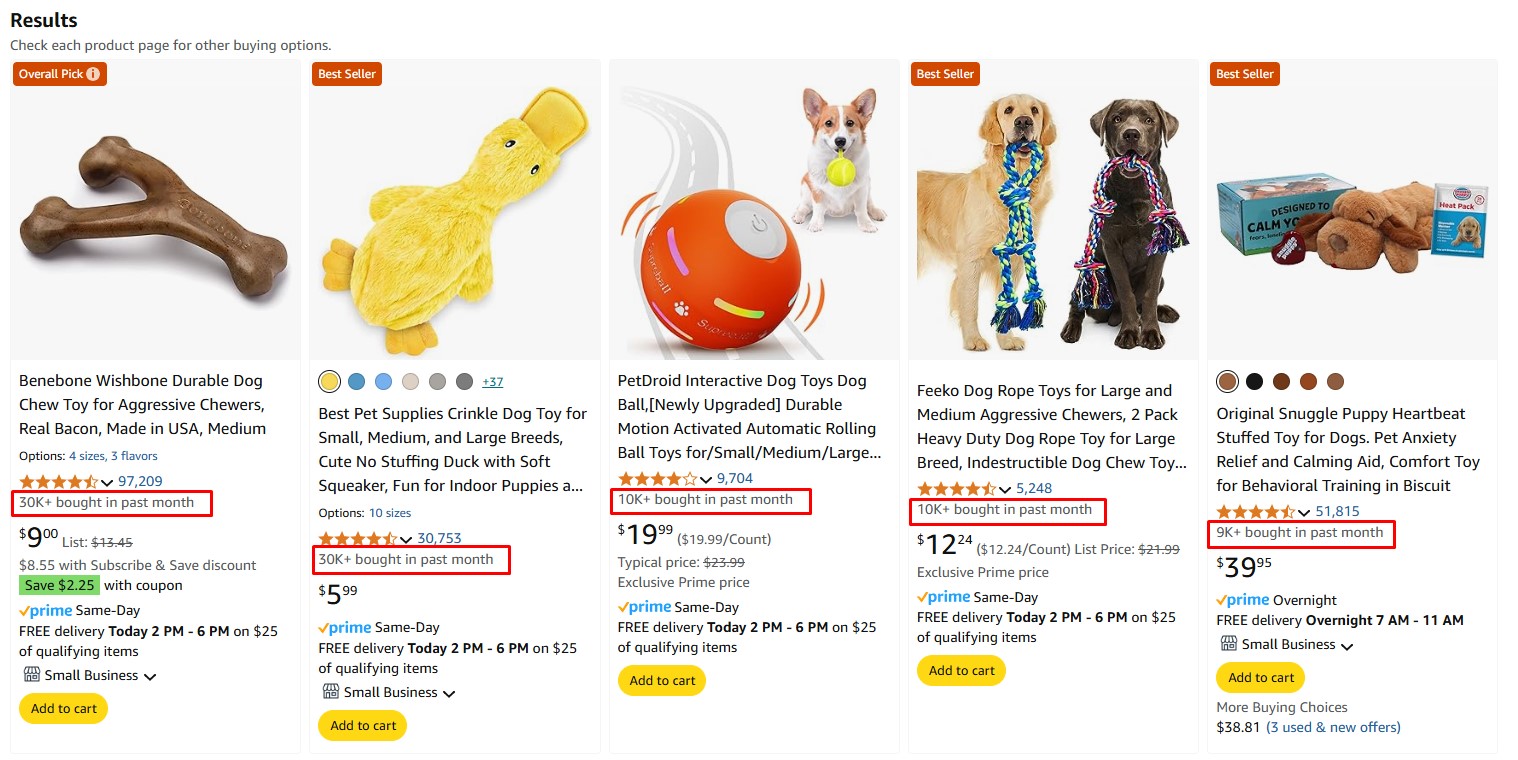
Recently Amazon introduced “Bought in Last Month” which you may have noticed on the search results page. Until now, all sales estimates (from any platform) were algorithmic guesses based on Sales Rank and this is the first time Amazon has ever published real sales data!
Bought In Last Month
"Bought In Last Month" For Variations 3

How “Bought in Last Month” for variations works

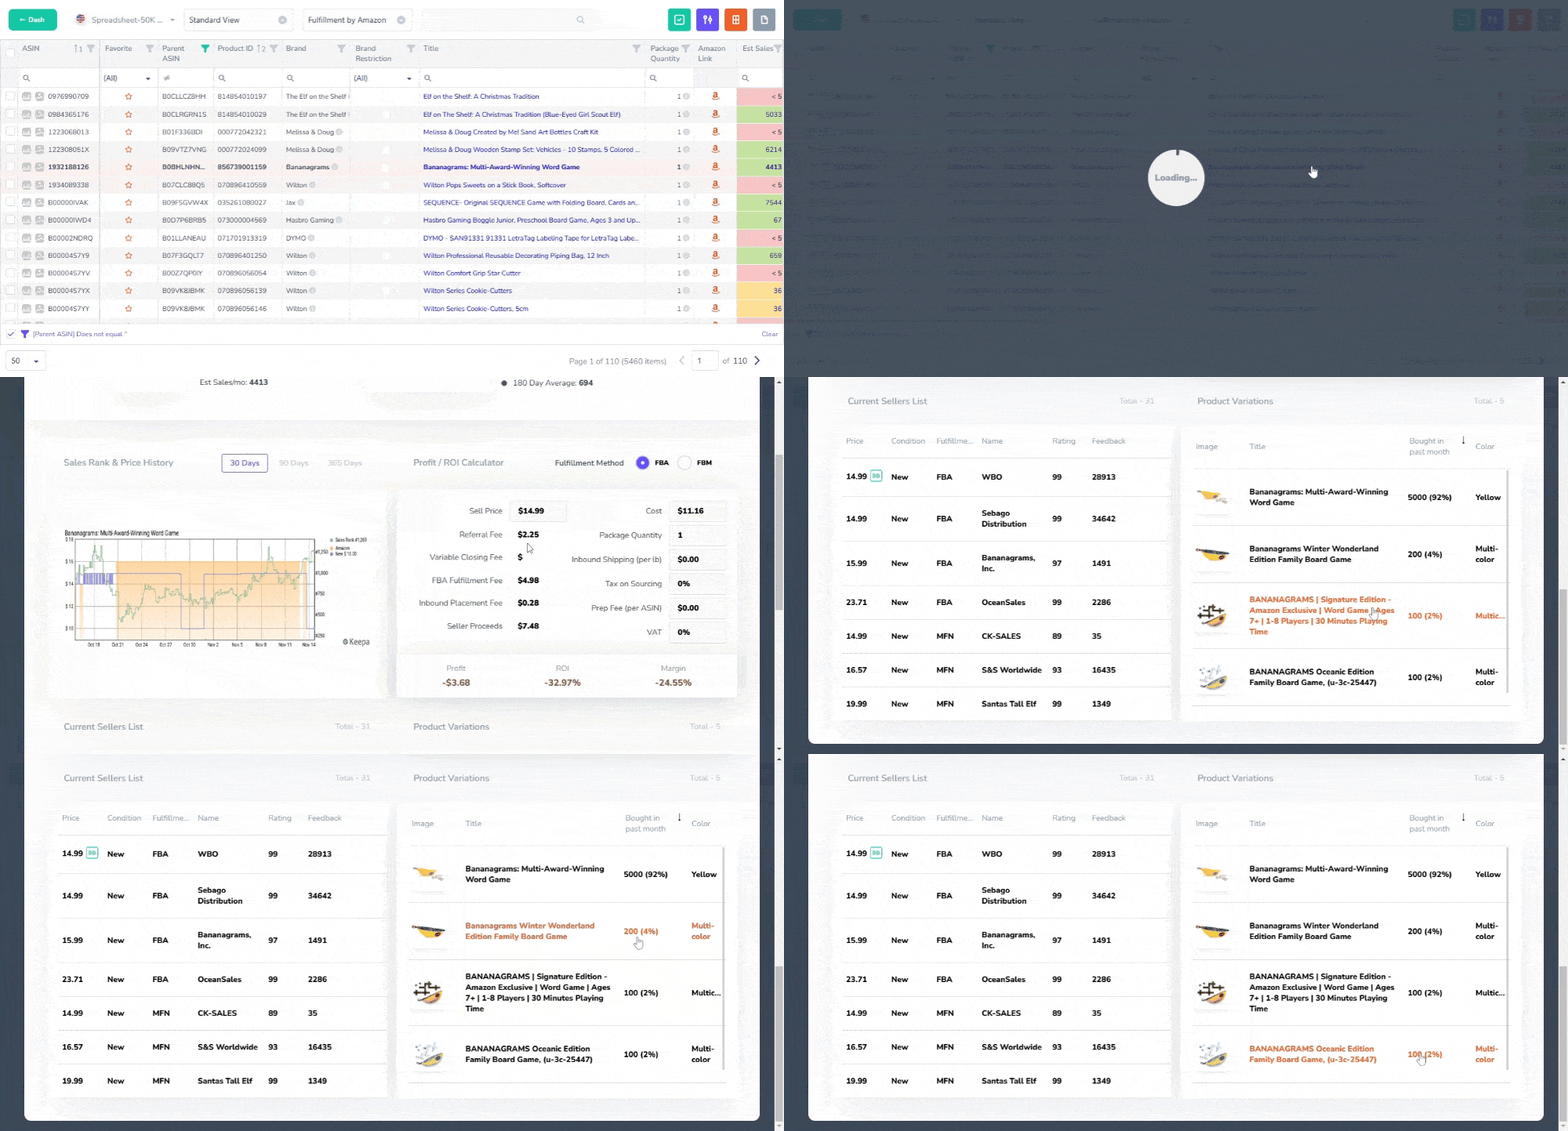
We’re introducing this data in the Product Detail page for Variations. You can access the Product Detail page by clicking on the Title for any product.

? The below example shows 5 variants with one of them getting 92% of the sales! What happens if you ordered the wrong variant without this data? ?
Chrome Capture 2024 11 14
"Bought In Last Month" For Variations 4

Some things to keep in mind..

Here are some housekeeping things to keep in mind to avoid confusion:

? “Bought in last month” is real sales data and it may vary from “Est Sales” which is an algorithmic estimate of sales. Do not be surprised to see this!

? Not all products have enough sales volume to generate a “Bought in last month” value. If you see a blank, that’s likely the case.

? This data is available to all license types currently. We plan to introduce “Bought in last month” to the main grid soon but that will only be available to Pro licensed accounts.

Why “Bought in Last Month” Matters for Sellers

If you’ve ever asked “which variation is actually selling?”—this is your answer.
“Bought in last month” gives you clear, real-time insight into what’s moving right now. No more relying on generic sales rank. You’re seeing actual Amazon buyer behavior tied to specific variants.

For Amazon sellers, this unlocks smarter inventory decisions, better ad targeting, and the confidence to double down on winning variants without the guesswork.

Whether you’re launching new SKUs or optimizing existing listings, “Bought in last month” data is a powerful lever you won’t want to ignore. Real data is key to finding a product to sell without guesswork


Hope you enjoy the update!  Please be sure to visit, subscribe and share our Facebook, YouTube & Twitter page to be the first to get the latest updates on program developments and new features!
Product Image URLs + Max File Size of 1MM Products!

New stage.analyzer.tools update features 2 enhancements to supercharge your Amazon sourcing based on popular requests directly from Amazon sellers.

? New Product Image URL column added to Column Chooser

? Auto file splitter enables uploads of massive Spreadsheets of up to 1,000,000 products! Max products per result increased from 50,000 to 100,000 products

Product Image URL Column

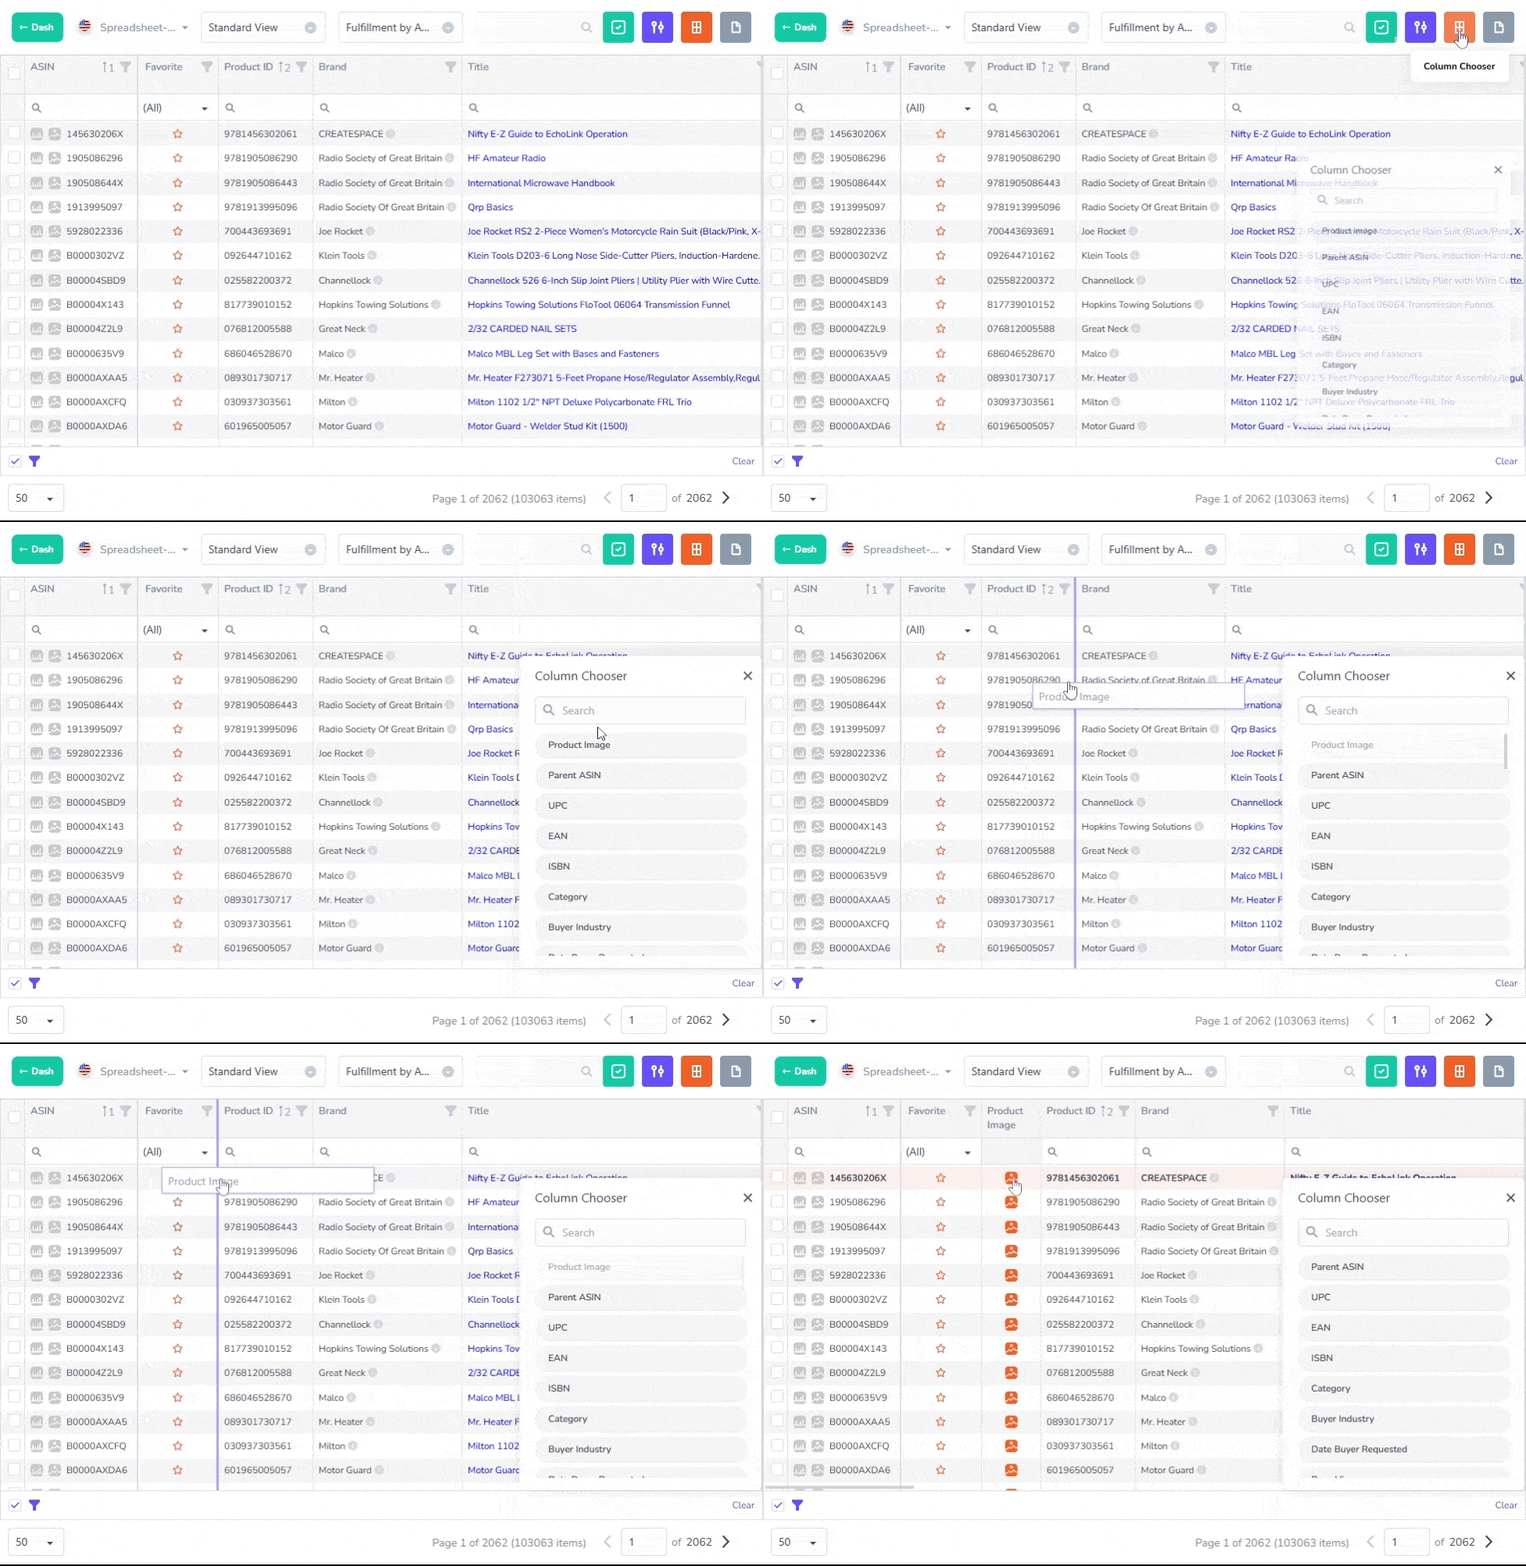
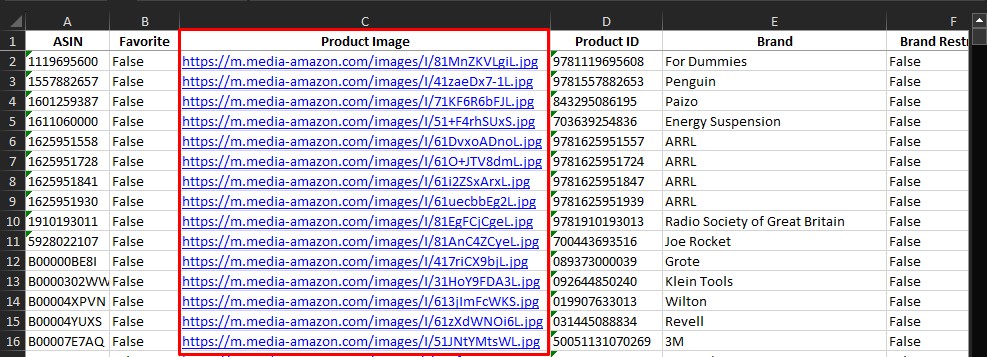
By popular request, we added a new column to the data grid for Product Image URL. This column can be added from the Column Chooser and links to the full size Amazon product image. When exported to Excel, the full URL of the Amazon product image will be included for each ASIN.

? Here is how to add the new column:

Add Product Image Url Column
Product Image Urls + Max File Size Of 1Mm Products! 9

? Here is what the column looks like when exported to Excel:

Product Image Url Excel
Product Image Urls + Max File Size Of 1Mm Products! 10

Upload Massive Spreadsheets- up to 1MM Products per Upload

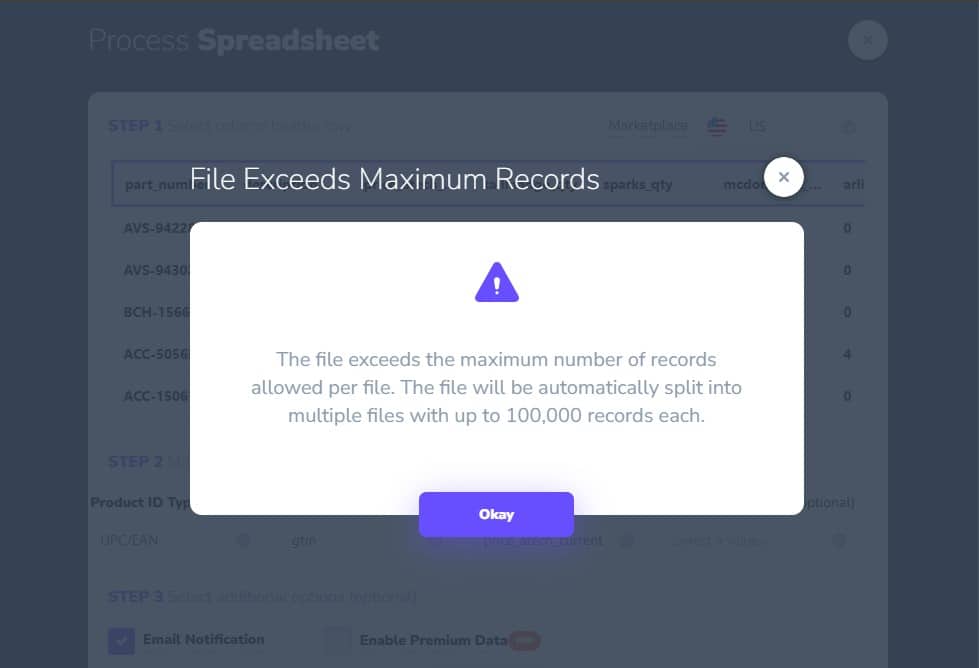
The app can now accept huge spreadsheets of up to 1,000,000 products per spreadsheet or a maximum file size of 200mb/file. Since showing so much data in a browser window is likely to cause computers to explode (it’s a joke), we automatically split the results into ~100,000 product chunks.

? Here’s what it looks like when we upload a 500,000 product catalog to a Spreadsheet Search:

Auto Splitter Warning
Product Image Urls + Max File Size Of 1Mm Products! 11

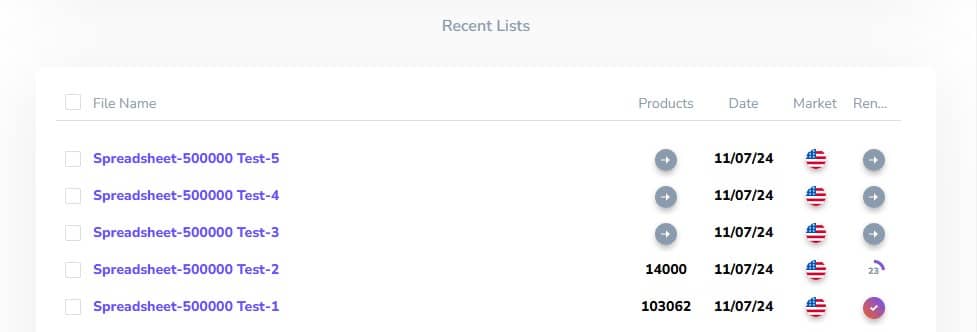
? The auto-splitter goes to work and splits your scan into ~100k product chunks which are processed one after the other until completion:

Auto File Splitter
Product Image Urls + Max File Size Of 1Mm Products! 12

Hope you enjoy the update!  Please be sure to visit, subscribe and share our Facebook, YouTube & Twitter page to be the first to get the latest updates on program developments and new features!
Bulk Convert thousands of Amazon ASIN, UPC, EAN or ISBN codes EASILY!

stage.analyzer.tools provides the solution to quickly bulk convert between thousands of UPC, EAN and Amazon ASIN codes! Watch the quick demo video to see how it works.

  • Introduction (00:00)
  • Load bulk spreadsheet for processing (00:10)
  • Review results (00:35)
  • How to get started (01:53)
  • Conclusion (02:17)

? FREE TOOL to convert individual codes (not bulk) you can use our free converter!

Please be sure to visit, subscribe and share our Facebook, YouTube & Twitter page to be the first to get the latest updates on program developments and new features!
stage.analyzer.tools Shifts Focus from from Windows app to Web app

To ensure the best experience for our customers we have decided to gradually sunset the Windows app and focus on the Web app which offers superior data and performance.

How did stage.analyzer.tools arrive at this decision?

The Windows app was the first iteration of stage.analyzer.tools and has been in service since 2016. A lot has changed since then and the app has reached some significant limitations, especially with spreadsheet processing speed.

Alternative to stage.analyzer.tools Windows app

stage.analyzer.tools flagship product is the Web app which offers all of the same functionality as the Windows app along with new features and much improved performance. The Web app has made the Windows app obsolete.

Web app advantages vs Windows app

  • Hosted in the cloud and accessible from any browser. You can access your files and process spreadsheets from anywhere,
  • ~100x+ faster processing speeds over Windows app,
  • Premium Data which provides loads of valuable historical data (Web app Pro)
  • Favorites functionality allowing you to build favorites lists to track products,
  • More modern user interface,
  • Deep scan feature which allows you to scrape most Amazon pages or competing seller storefronts with up to 100k results (Web app Pro).

What does this mean for Windows app customers?

If you’re a current Windows app customer, you can continue using the Windows app but the app performance and support will be limited. We recommend upgrading your subscription to the Web app, please contact support for a convenient upgrade link.

If you would like access to the Windows app, we will continue to make it available for the time being by special request only. You can request a special purchase link by contacting support.

Resolving UPC/EAN Mismatches with Supplier Catalogs

If you search by UPC/EAN you may notice some results do not match your supplier’s products. These results may be a different product from a completely different supplier. This is somewhat common to Amazon and the reason behind it is not what it may first seem…

Results don’t always match my supplier’s catalogue

In this scenario stage.analyzer.tools scans a UPC/EAN from your supplier and generates results that don’t match what’s sold from your supplier. What gives?

This can happen when brands purchase non-exclusive EAN/UPC codes which are often re-sold and used by multiple other brands. When those brands list their products on Amazon, the result is entirely different products associated with the same UPC/EAN. While at first glance, this situation seemed like a data problem with stage.analyzer.tools or Amazon, it’s actually not related to either.

Solution

To deal with this scenario, stage.analyzer.tools provides a number of capabilities.

  • Initially, ignore the mismatches and filter the entire result to a manageable short list by filtering to products that are selling profitably (based on Profit, ROI, Sales Rank, etc.). For help on how to use the app’s filters and gridviews to do this efficiently, check this video.
  • Now that you have a manageable short list of products that sell through with potential profit, it’s time to dig in and eliminate the mismatches.
  • Use one or both methods below to identify the mismatches and remove them from the result by using the right click > Hide feature.

Method 1- Use the Product Image hover

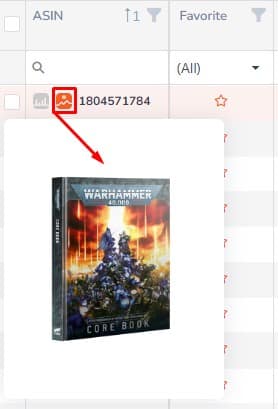
Hover over the product image icon to show the matched product image. If the product image is not the same product as your supplier, it’s usually obvious. ie- the product shown below is a book, if you were expecting a kitchen appliance the image would clearly indicate a mismatch.

How To Deal With Upc/Ean Mismatch
Resolving Upc/Ean Mismatches With Supplier Catalogs 16

Method 2- Add a Reference Column

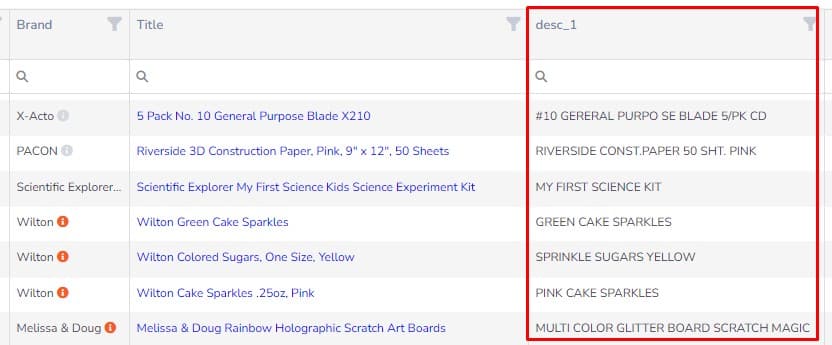
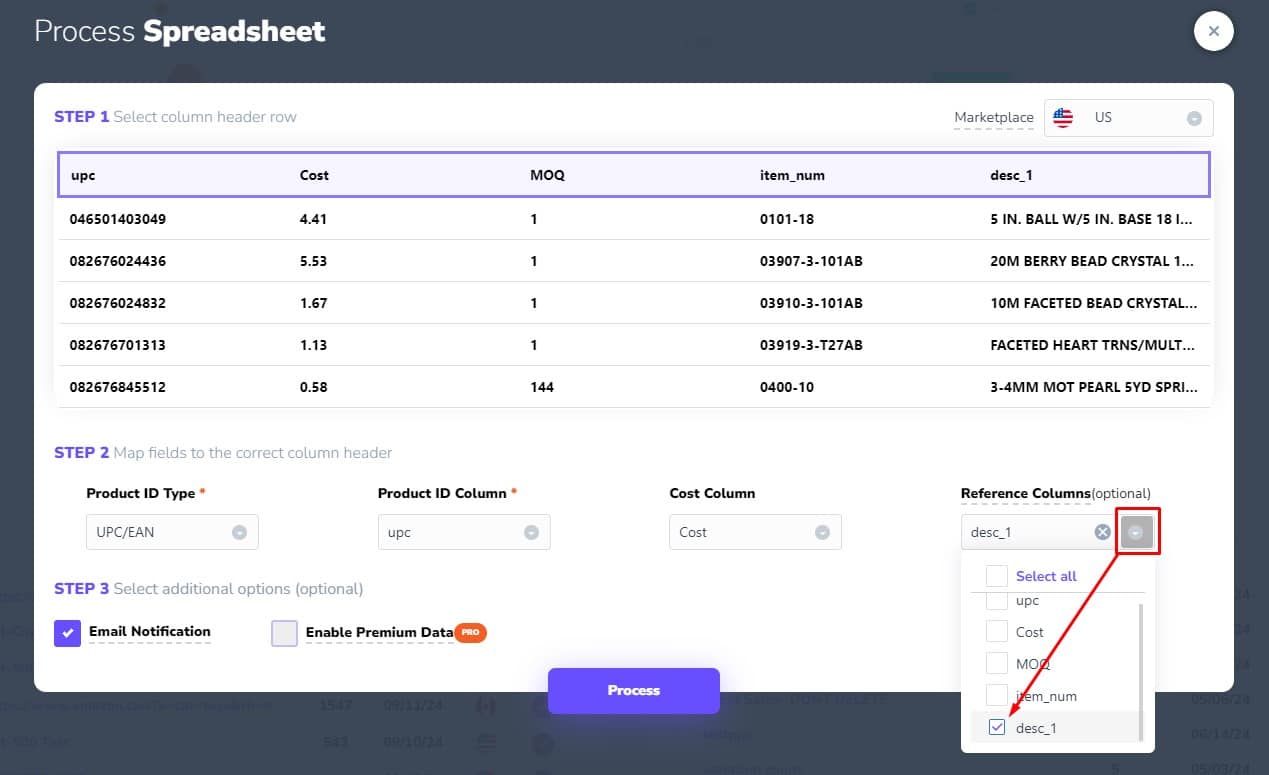
Add a Reference Column to your results with the product name from your supplier’s price sheet . This column will be appended to your results and will allow you to cross reference the result’s Amazon Title to the original product name from your supplier’s spreadsheet. This allows you to spot products that don’t match based on different product names.

How To Deal With Upc/Ean Mismatch
Resolving Upc/Ean Mismatches With Supplier Catalogs 17
Reference Columns2
Resolving Upc/Ean Mismatches With Supplier Catalogs 18

Related background- multiple results per UPC/EAN

Amazon allows multiple listings for the same UPC/EAN. By default, stage.analyzer.tools will return ALL matching listings which may result in multiple results for the same UPC/EAN, this is normal behavior. Please see this article if you would like to modify the number of matches stage.analyzer.tools delivers.

Conclusion

Amazon sells millions of products and sometimes the results can be messy and perplexing. Using a bulk analysis app like stage.analyzer.tools provides the tools you need to analyze Amazon products more efficiently.

How to Update Payment Method

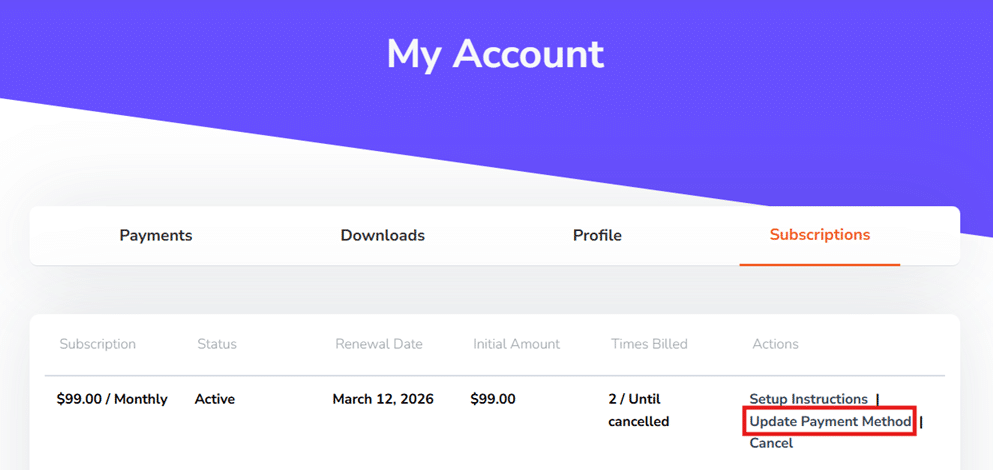
You can update your payment method by logging into the My Account > Subscriptions section of the website.

Once your payment method is updated, please contact our support to process failed payments in order to reinstate service immediately.

👉 If you signed up using PayPal, the source of payment is managed within your PayPal account and not on our website. We no longer support PayPal for new subscriptions, due to its limitations.

Update Payment Method 1
How To Update Payment Method 20

Inbound Placement Fees for Amazon US Market

The Additional Expenses menu in stage.analyzer.tools Web app has been updated to keep your business profitable with the new Amazon Inbound Placement Fees. Read Amazon’s full details about the new fee on this page.

How Amazon Placement Fees Work with stage.analyzer.tools

We used the simplest implementation possible to ensure the Amazon Placement Fees don’t slow you down. Simply select the placement option of your choice in the Additional Expenses menu on any results page. The app will calculate the new fees automatically and remember your selection.

Stage.analyzer.tools Inbound Placement Fee Feature
Inbound Placement Fees For Amazon Us Market 25

What are Amazon Inbound Placement Fee Options in US?

? Minimal Shipment Splits– sent to 1 location; Amazon will ship to as few FCs as possible but it will come with an extra fee per unit.

? Partial Shipment Splits– sent to 2-3 locations; Amazon will find a middle ground. You will have a few split shipments and reduced fees versus Minimal.

? Amazon Optimized Shipment Split– sent to 4+ locations; Amazon will ask you to ship to the most unique FCs, but with no placement fee. However, this will increase your average per pound shipping rate. We recommend using $0.60/lb. for Inbound Shipping Fee for this option.

? Please note that Placement Fees are charged in a range for Partial and Minimal splits and stage.analyzer.tools uses the highest range to be conservative. Your actual Placement Fees may be lower depending on the FC region selected in your shipping plan.

Where to find Inbound Placement Fees in stage.analyzer.tools

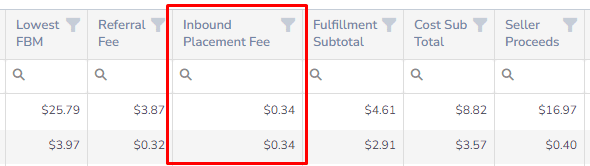
✅ In the grid– We added a column named “Inbound Placement Fee” to the grid in the Full Data View. As with all columns, this column is available to add to any view using the Column Chooser.

Stage.analyzer.tools Inbound Placement Fee Column
Inbound Placement Fees For Amazon Us Market 26

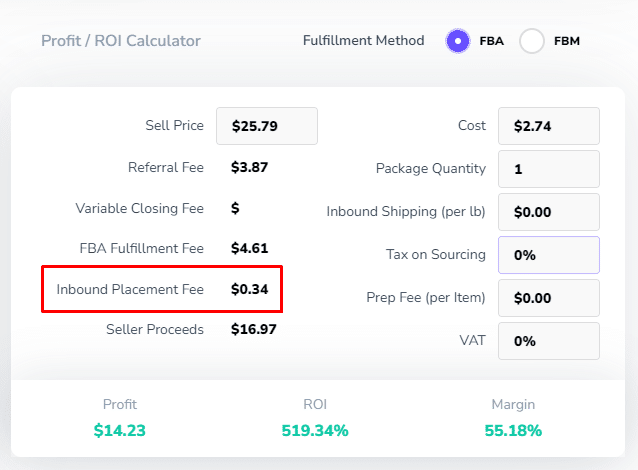
✅ Product Detail Fee Calculator– Click on any product Title to access the Product Detail page. The Profit/ROI Calculator on this page is also updated to show the Inbound Placement Fee.

Stage.analyzer.tools Inbound Placement Fee In Profit/Roi Calculator
Inbound Placement Fees For Amazon Us Market 27

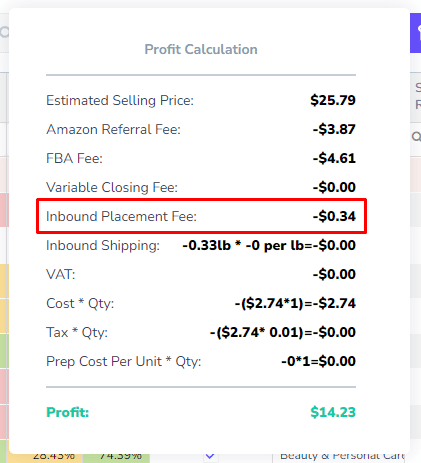
✅ Profit Hover in the Grid– Hover your curser over the Profit cell in the grid to see a detailed profit calculation. Inbound Placement Fee has been added here as well for clarity.

Stage.analyzer.tools Inbound Placement Fee In Profit Hover
Inbound Placement Fees For Amazon Us Market 28

That’s all folks!

Hope you enjoy the update!  Please be sure to visit, subscribe and share our Facebook, YouTube & Twitter page to be the first to get the latest updates on program developments and new features!
Edit Saved Views, Delete Results in Bulk, More!

Web app update features quality of life improvements based on popular requests from our users!

? Delete Results in Bulk From the Dashboard

? Edit Saved Gridviews

? Remove Favorites in Bulk

Delete Results in Bulk From the Dashboard

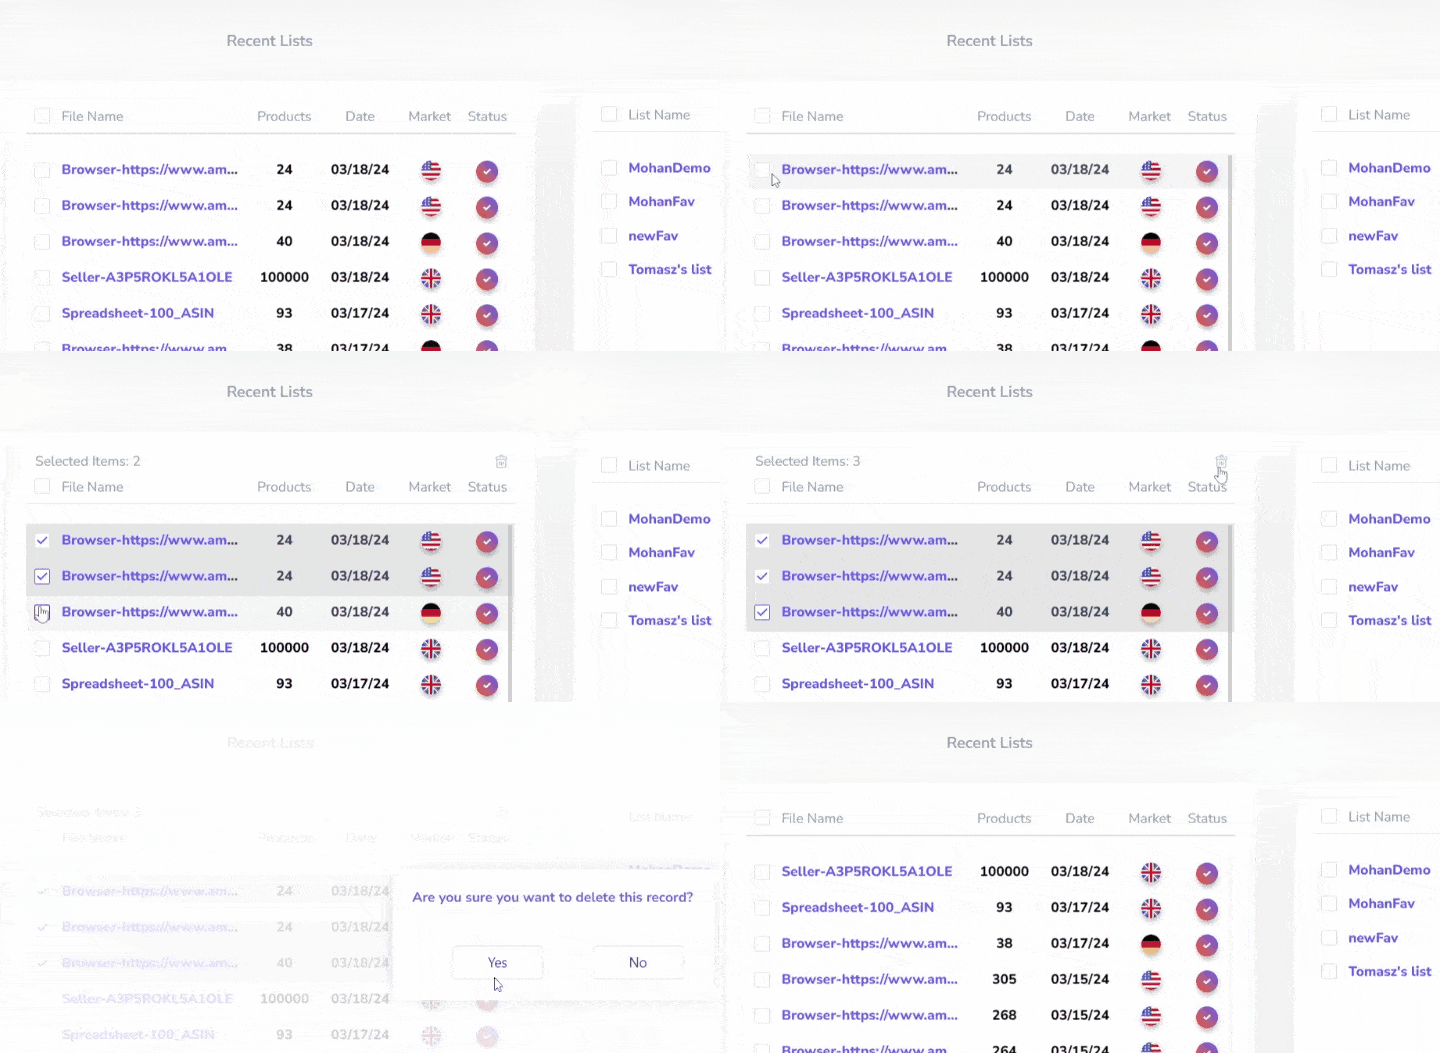
Instead of deleting each result one at a time, select and delete with a single click!

Chrome Capture 2024 3 19 4
Edit Saved Views, Delete Results In Bulk, More! 32

Edit Saved Gridviews

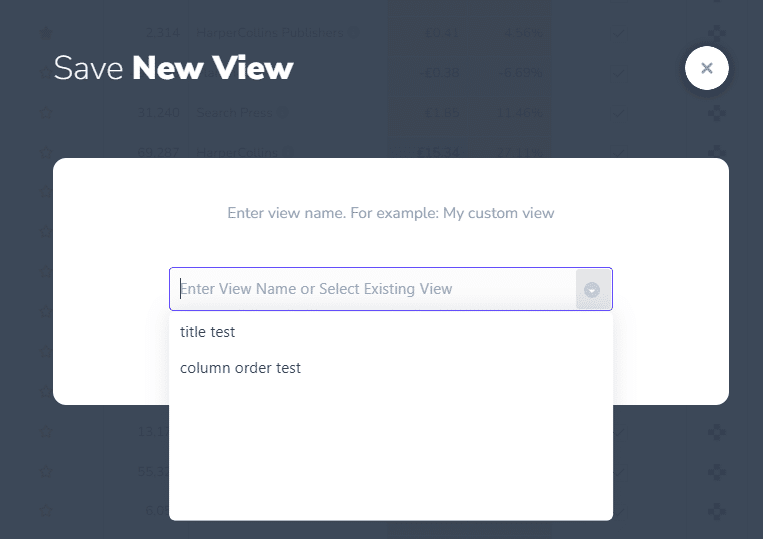
Ever wish you could edit a custom view that you already saved? Now you can apply changes to an existing gridview! Just follow the same steps to save your view but instead of creating a new one, you can now select an existing view to replace.

Image
Edit Saved Views, Delete Results In Bulk, More! 33

Remove Favorites in Bulk

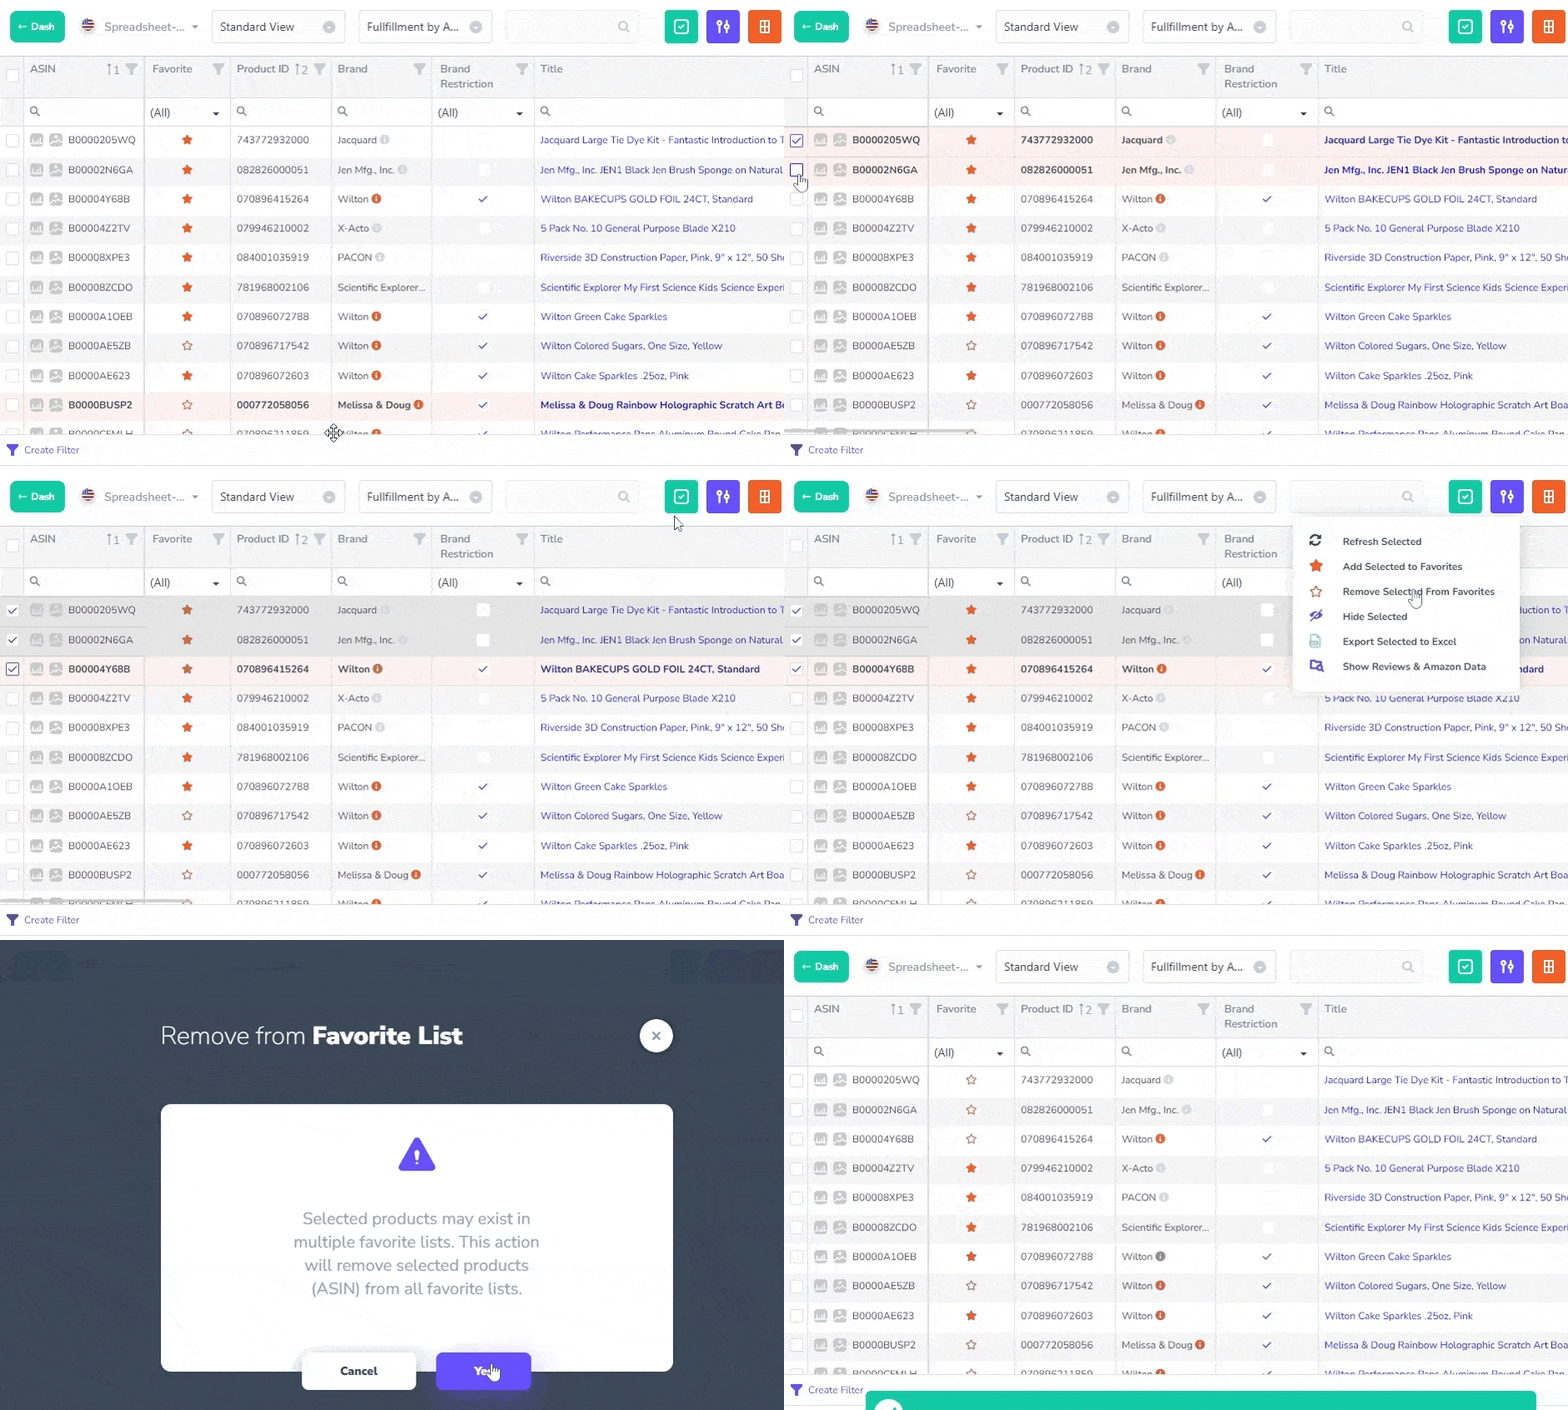
Remove multiple favorites (or all favorites) at once using the new multi-select feature “Remove Selected from Favorites”.

Chrome Capture 2024 3 20
Edit Saved Views, Delete Results In Bulk, More! 34

Hope you enjoy the update!  Please be sure to visit, subscribe and share our Facebook, YouTube & Twitter page to be the first to get the latest updates on program developments and new features!
Using Averages for Estimated Sales and Sell Price

Using averages to calculate Estimated Sales and Sell Price is a game changer since it provides more accurate sales estimates and profit calculations which are adjusted for daily volatility. These setting options allow Estimated Sales to be calculated based on 30, 90 or 180 day Sales Rank averages. Similarly, Sell Price can be set based on the 30, 90 or 180 day average BuyBox. These are powerful features which deliver more accurate results by smoothing out daily fluctuations in Sales Rank and Sell Price.

  • Introduction to how it works (00:23)
  • Settings screen and detailed explanation (0:24)
  • Example of how it works (01:10)
  • Comparison of using averages vs live data (2:06)
  • Conclusion (05:30)

? Have any questions or suggestions? Reach out to us!

? Please be sure to visit, subscribe and share our Facebook, YouTube & new Twitter page to be the first to get the latest updates on program developments and new features!
How Using Averages for Sales and Sell Price Improves Your Product Analysis

Daily swings in sales rank and pricing can make products look more profitable than they really are—or hide great deals that deserve a closer look. That’s where the new settings for using 30, 90, or 180-day averages come in. By relying on historical data instead of today’s numbers, you’ll spot hidden winners and avoid misleading duds.

Why Use Averages?

When you only look at the current sales rank or sell price, you get a snapshot of that moment in time. Products on Amazon fluctuate constantly—some jump in rank and price because of seasonality, stockouts, or sudden demand spikes. Others fall just as quickly.

By basing your estimates on longer-term averages, you’ll:

  • Smooth out daily ups and downs
  • Get a more accurate view of monthly sales
  • Avoid chasing short-term trends that might fizzle

How to Switch to Averages

  1. Open Settings: Look for the options to enable averages for Estimated Sales and Sell Price.
  2. Choose Your Window: Decide if you want 30, 90, or 180-day averages.
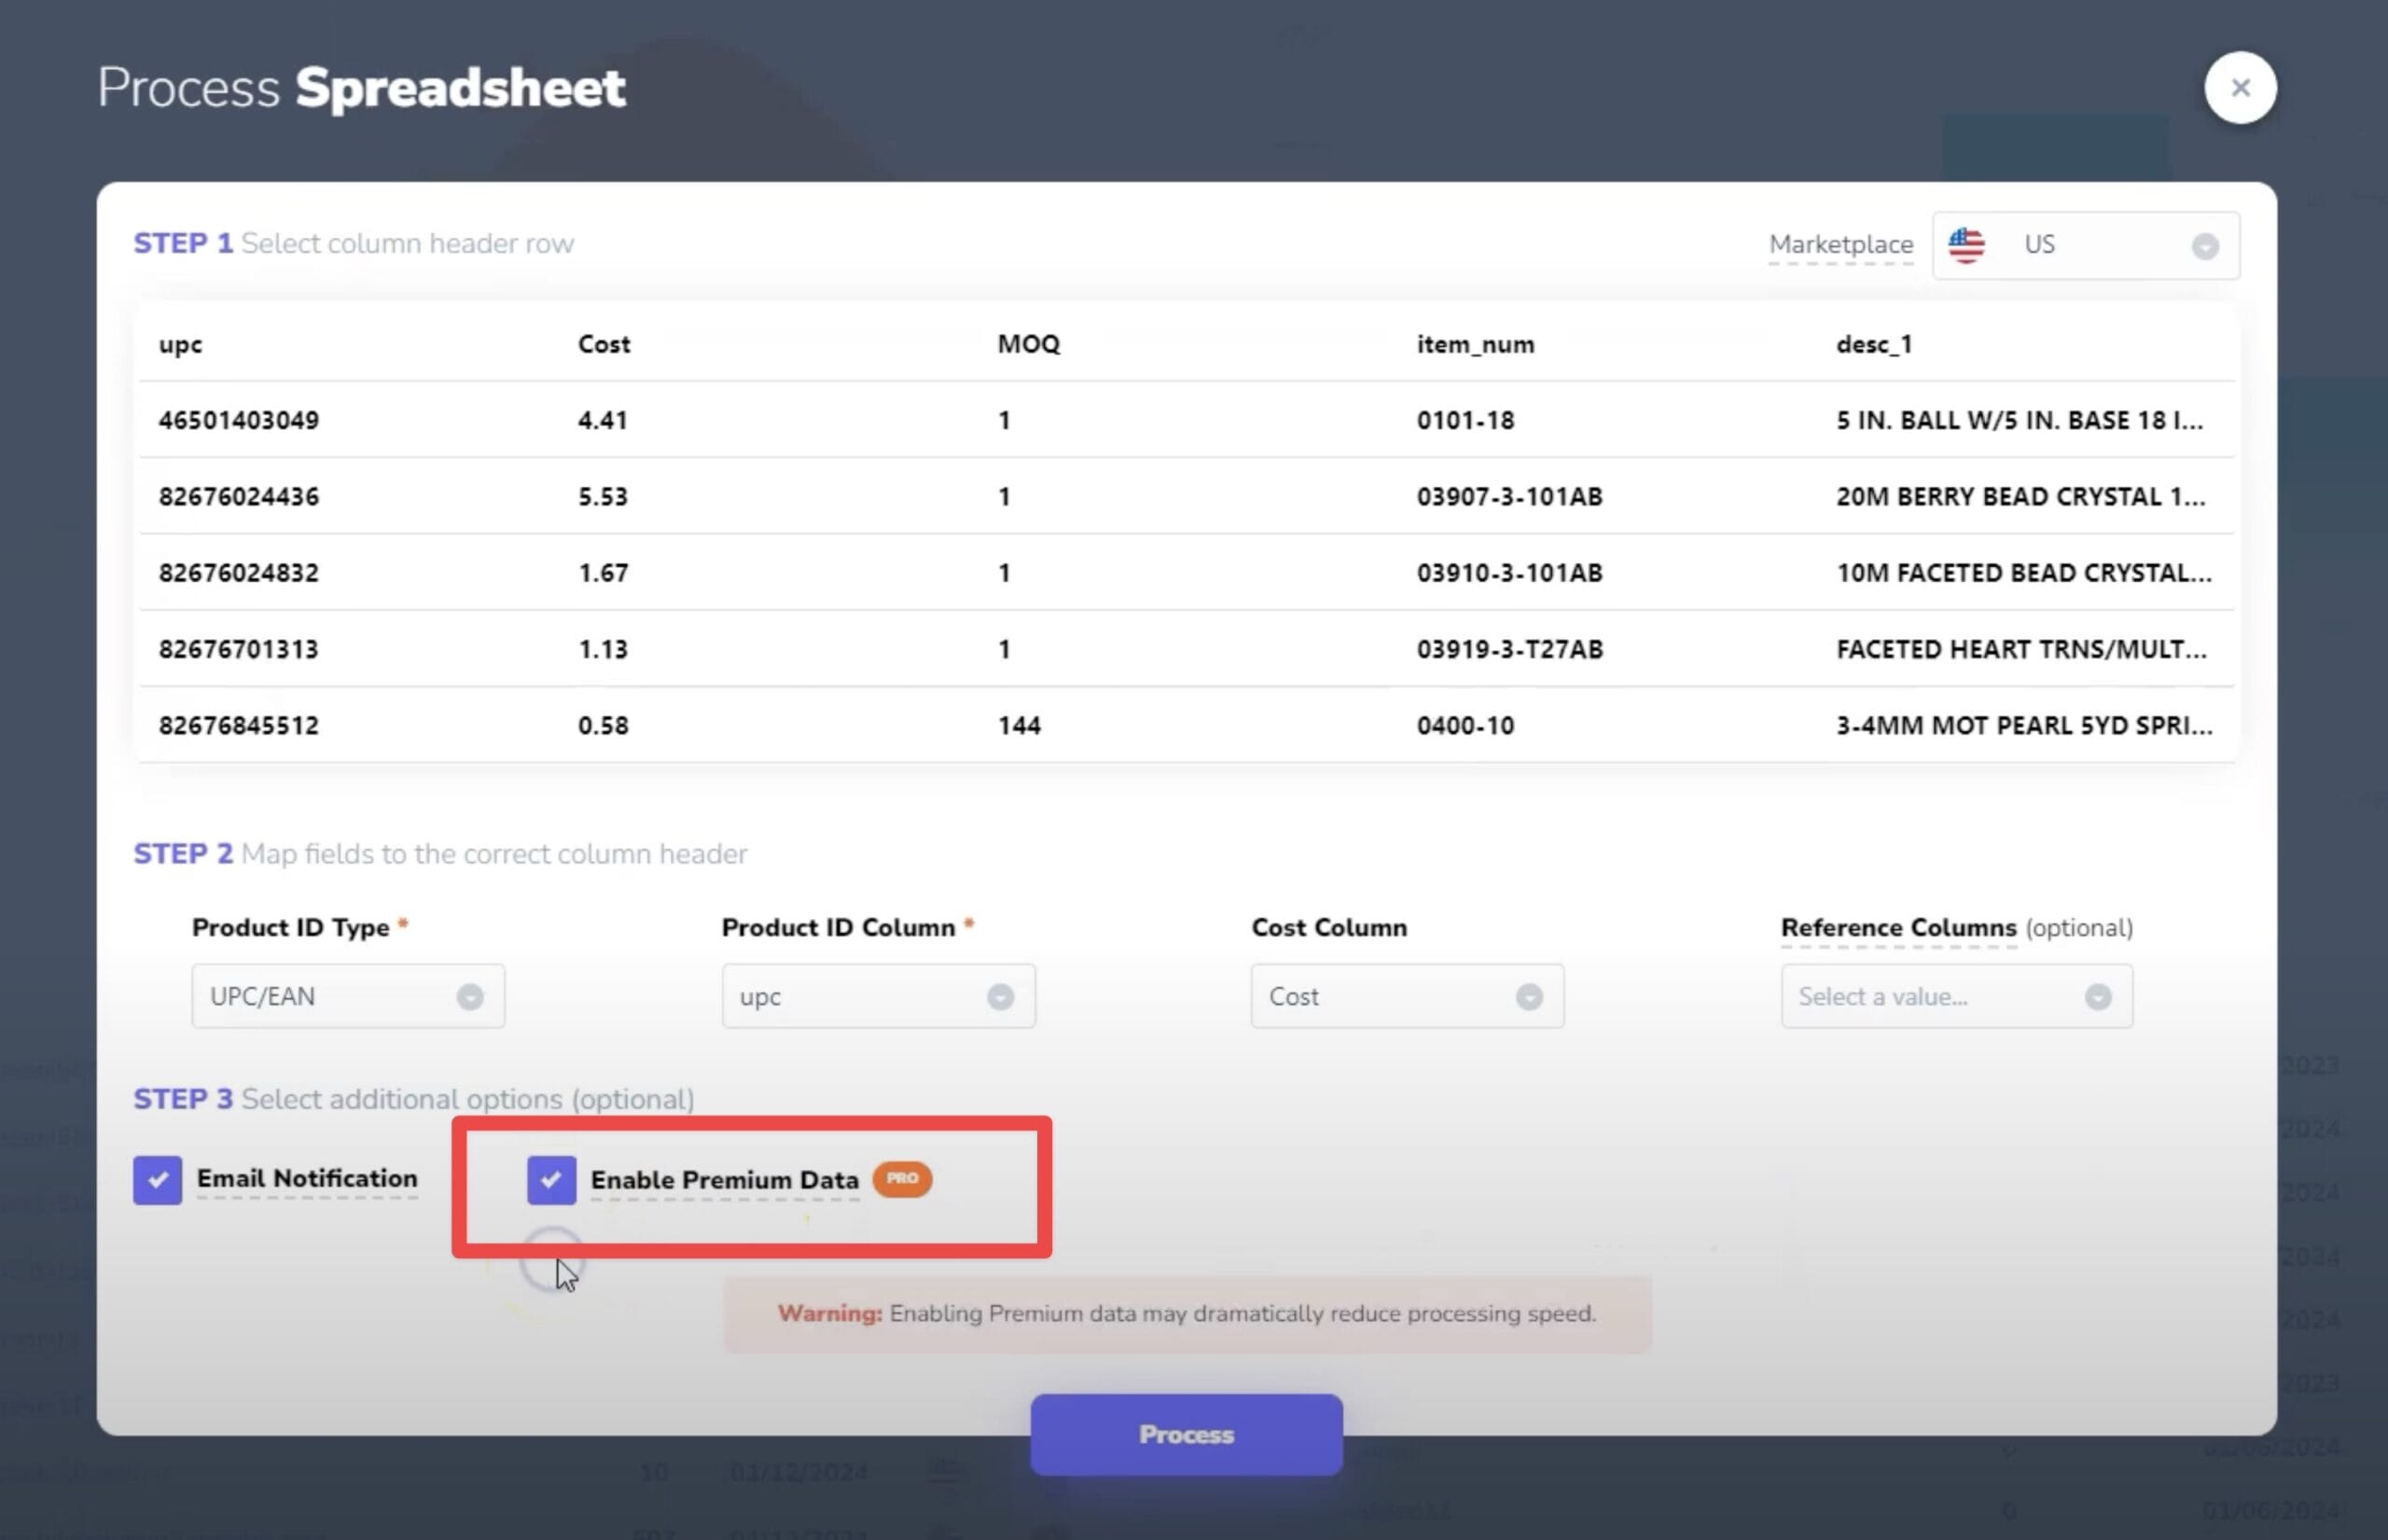
  3. Enable Premium Data: This is needed for historical data to work. Otherwise, the system defaults to the current number.
  4. Upload Your Spreadsheet: Process it like you normally would.
  5. Look for the Flags: Once the scan finishes, you’ll see tags showing which columns use averages.

Example 1: The “Fake Winner”

In one scan, the product showed:

  • 30 sales/month using current data
  • $0.77 profit

It looked pretty good. But looking at the 180-day average revealed:

  • Fewer than 5 sales/month
  • $3.75 loss

The product’s price and rank had wild swings—on one day, the sales rank was under 100K, on another it was over 400K. By using only the current snapshot, you risked choosing a losing product.

Example 2: The Hidden Gem

In another scenario, the product showed:

  • 47 sales/month using current data
  • $42 profit

But the 180-day average indicated:

  • 85 sales/month
  • Even higher profit

If you had filtered this item out based on current data, you’d have missed an even stronger performer that, in the long run, brings in higher profit and more sales.

Why This Matters

Relying on just today’s numbers can cost you money—or lead you to invest in a product that barely moves. Averages help you:

  • Avoid chasing fleeting spikes
  • Pinpoint more stable, long-term performers
  • Look beyond what’s happening in a single moment

Bottom Line

Using averages for your estimated sales and sell price settings gives you a clearer, more reliable view of a product’s true potential. Daily data can be misleading—one day’s spike or dip might hide a product’s real performance. By looking at 30-, 90-, or 180-day averages, you’ll smooth out those swings, avoid bad buys, and uncover hidden gems you’d otherwise miss.

Also see: Amazon Statistics: A 2025 Look at Users, Sellers, Revenue, and Marketplace Trends

Averages for Est Sales and Sell Price, Brand Blocklist, Performance & more!

New major update launched for the web application adds new powerful features and dramatically improves performance.

Web App Update 1.15.24 2
Update Highlights-

✨ Using Averages to Calculate Estimated Sales and Sell Price

? Brand Blocklist

? Process Spreadsheet Screen

..& much more!

Using Averages to Calculate Estimated Sales and Sell Price

Using averages to calculate Estimated Sales and Sell Price is a game changer since it provides more accurate sales estimates and profit calculations which are adjusted for daily volatility.

This is a major step forward in using metrics that predict Amazon product success, rather than relying on surface-level snapshots.

New setting options allow Estimated Sales to be calculated based on 30, 90 or 180 day Sales Rank averages. Similarly, Sell Price can now be set based on the 30, 90 or 180 day average BuyBox.

Brand Blocklist

By popular demand, the Brand Blocklist setting allows adding Brands to a universal block list which ensures that products sold by the blocked Brands are automatically removed from all results.

Process Spreadsheet Screen

The Process Spreadsheet screen has been redesigned for better functionality and column header row selection. It’s no longer necessary to modify your spreadsheets to place the column header in the first row. Simply select the column header row directly from the Process Spreadsheet screen.

Other Updates

  • Completely overhauled front-end and back-end for improved performance
  • New “Exclude Not Found on Amazon” feature excludes products that are not found from results
  • New Brand Restriction column allows easy filtering for restricted brands
  • Added additional tool-tips to all menus for better user experience
  • Processing progress % has been improved for better tracking
  • Clicking the Enter key has been configured to equal action on all menus for better user experience
  • File naming convention in Recent Lists is now consistent with search names
  • Historical Data feature has been renamed to Premium Data
  • Product Detail page performance improvements for faster loading
  • Too many other small updates and fixes to list.

Related: Amazon Statistics: A 2025 Look at Users, Sellers, Revenue, and Marketplace Trends

Hope you enjoy the update!  Please be sure to visit, subscribe and share our Facebook, YouTube & Twitter page to be the first to get the latest updates on program developments and new features!